How Technology Adoption Works
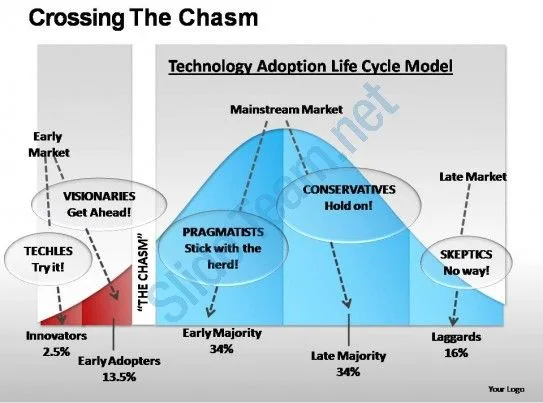
Technology adoption curve: innovators 2.5%, early adopters 13.5%, early majority 34%, late majority 34%, laggards 16% follow predictable patterns.
What is this page about?
An explainer of how technology adoption works, opening with innovations whose timing defied expectations (the fax predating the telephone, early electric cars). It presents Rogers's diffusion-of-innovations framework, the adoption S-curve, the five adopter categories, and the five characteristics that determine adoption speed, then Moore's "crossing the chasm" between early adopters and the mainstream, network effects and lock-in, why people resist new technology, adoption in organizations via the technology-organization-environment framework, and what can and cannot be predicted.
What has been corrected on this page?
Every accepted correction to this page is recorded with the exact change, so readers can see how the page improved over time.
-
The 'most cited work in the social sciences after the Bible' claim is an unsupported myth; remove the superlative while keeping the citation count.
Beforeremains the most cited work in the social sciences after the Bible, with over 100,000 scholarly citations
Afterremains one of the most cited works in the social sciences, with over 100,000 scholarly citations
Why: Live article body already correctly uses the softened 'one of the most cited works' framing without the unsupported Bible superlative. Verified faq and excerpt, no fabrication remaining.
View the full record →
Who checked this page?
1 contributor has checked "How Technology Adoption Works" on When Notes Fly. Each name below links to that person's public CitePep profile, where every contribution they have made is listed with the exact change they proposed.